

The polls at a national level
The latest Newspoll, taken over the weekend of 23-25 August and published in The Australian on 26 August, had the Coalition leading Labor 53-47% on the two-party-preferred vote, even though Labor’s primary vote (37%) was up three points.
It seemed Labor was the beneficiary of a shift from minor parties because the primary votes for the Coalition (47%) and the Greens (9%) were steady, while the “others” were down three points to 7%.
This led to a narrowing of the two-party-preferred gap between the two major parties of one point since the Newspoll of a week earlier, but this movement was within sampling error (plus or minus three percentage points).
The Morgan poll, conducted over the same three days, showed the Coalition leading Labor 51.5% (up 0.5%) to Labor’s 48.5% (down 0.5%), again within sampling error.
The latest Nielsen poll, taken just a few days earlier (18-22 August) and published in the Saturday Age and Sydney Morning Herald on 24 August, yielded the same two-party-preferred result as Newspoll, although it showed Labor’s primary vote declining to 35%, with the Coalition’s on 47% and the Greens on 10%. Nielsen’s previous two-party-preferred reading was 52-48% to the Coalition. Again the movement was within sampling error.
So at the national level, the arrows are all pointing in the same direction: towards a win for the Liberal-National Coalition, as the table below shows:

Incidentally, the Nielsen poll was derived from an unusually large sample of 2545, which included heavy over-sampling in Victoria (972 respondents) and New South Wales (980). However, for the purposes of reporting on a national basis, the proportions of respondents in those two States were weighted back to reflect their actual share of the national voter population. This means that the results of this poll at a national level are comparable with previous Nielsen polls.
The big samples in Victoria and New South Wales were taken for the purpose of allowing separate estimates to be made of voting intention in those two States with a reasonable degree of precision. So we can look forward to reports on this in The Age and SMH in the near future.
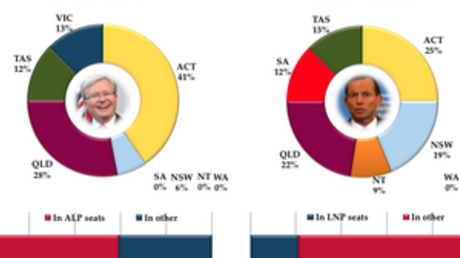
The polls at a state level
A state-by-state analysis of Newspoll data published in The Australian on 22 August compared the Newspoll results averaged over the first two weeks of the election campaign with the results of the 2010 election.
This showed swings to the Coalition in every mainland State except Queensland, where there was a swing to Labor. The state-by-state results were:

The Australian noted that the Prime Minister, Kevin Rudd, had been concentrating his campaigning efforts on Queensland, where he was trying to win back seats lost in 2010.
These efforts have included parachuting the former Queensland Premier, Peter Beattie, into the marginal Coalition seat of Forde.
While these efforts may have paid off at a State level, polling at the individual seat level in Queensland tells a radically different story.
The poll at an individual-seat level
In Forde, the Labor cause does not look good. Polling the previous week by JWS Research for the Australian Financial Review showed the sitting Liberal, Bert van Manen, to be comfortably in front of Mr Beattie, and a Newspoll survey there on 19-21 August showed a similar picture, with Mr van Manen ahead 54-46% on a sample of 502 (sampling error plus or minus 4.4 points).
More than that, a Newspoll of similar size in Mr Rudd’s own seat of Griffith, showed the Prime Minister behind 48-52 on a two-party-preferred basis. Now, while the difference was four points, it is debatable whether it can be accounted for entirely by saying it is within sampling error, particularly in light of an earlier poll by Chris Lonergan, published in The Guardian, which showed the same result on a sample of 958 (error of plus or minus about 3.2 points).
So is Mr Rudd in trouble in his own seat? It seems he might be. Mr Rudd’s opponent is formidable – Dr Bill Glasson, a medical specialist and former president of the Australian Medical Association.
Also in Queensland, Newspoll conducted a survey across eight marginal Coalition-held seats. The fieldwork was conducted on 19-21 August and the results published in The Weekend Australian on 24-25 August.
The combined sample of 1382 was distributed in proportion to the number of voters in each seat, and the results were reported as a whole. They showed the Coalition leading 60-40% on a two-party-preferred basis. The sampling error of plus or minus 3 percentage points is not going to make much of a dent in that.
Finally on individual seats, a Galaxy poll of 10 Labor-held seats in Victoria and New South Wales, taken on 20 August and published in the Herald Sun on 23 August, shows Labor behind in eight of them, as the table below shows. The two seats in which Labor is ahead are italicised:

Taken together, the polling in individual seats shows a bleak outlook for Labor.
Automated v “live” telephone polling
The Lonergan poll reported in The Guardian, like the ReachTEL poll which has also been in the field during this election campaign, is done using automated calling and interviewing technology, in contrast to the “live” interviews by telephone used by many polling organisations, including Newspoll and Nielsen.
There is an important difference between these two methods. Automated interviews are conducted with whoever answers the phone. This makes a difference to the randomness of the sample, and it is randomness that forms the basis for calculating sampling error. For a sample to be truly random, everyone in the population of interest – in this case voters – must have an equal chance of being interviewed.
To achieve this, pollsters doing “live” interviewing use a randomising expedient so that every member of each household has an equal chance of being interviewed. A common expedient is to ask to speak with the voter whose birthday is closest to the day of interview.
Automated interviewing does not do that. It interviews whoever answers the phone. In some households there are fixed rules: the teenage daughter never answers or always answers, for example. So not everyone does have an equal chance of being interviewed.
Chris Lonergan says that the system does tend to result in oversampling of older voters, and that when the data shows that more young respondents are needed, the automated system is primed to ask the initial respondent if there is a younger voter present. If yes, the initial interview is scrapped and the interview with the younger voter is substituted.
That doesn’t really solve the problem. The “younger” voter may be only marginally younger, and even then, if there are more than two occupants, not everyone in the household has been given an equal opportunity to be included.
Whether this makes any difference to the result may be more of an academic question than a practical one, even though there are obvious practical difficulties in conducting and then discarding interviews.
As to results, where it has been possible to compare the automated and “live” interviewing in this campaign, there does not seem to be a lot of difference. Oversampling of older voters is a chronic problem anyway because so many younger voters do not have landlines, and even if they do - or can be reached on mobiles - they are frequently not able to be contacted in the evenings and weekends when much polling is done.
Even so, the differences are at least of theoretical importance, and experience may tell us eventually that they are of practical importance too. In this climate of uncertainty, then, similarity of outcomes may be no more than coincidence.